
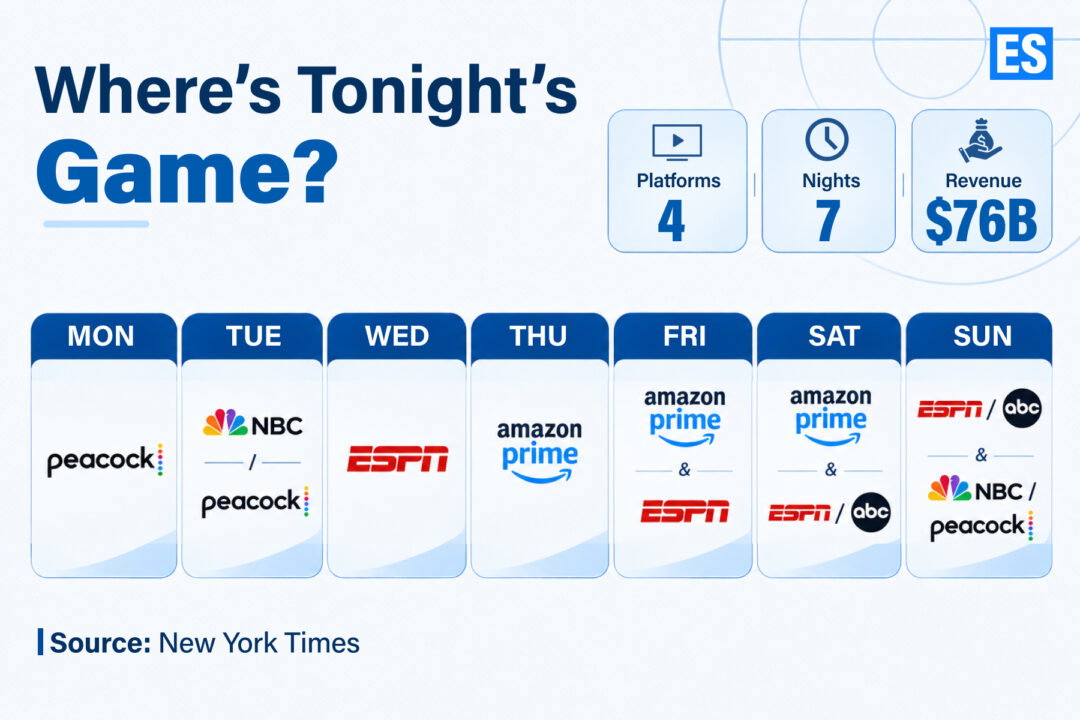
A basketball fan is now faced with a daily logistical puzzle across remotes and OTTs as to whether the game tonight is on cable, a streaming platform, or an app only. It’ll vary from day to day whether it’s on Disney cable, an NBC station, Peacock, or Amazon Prime Video. This daily trouble is a direct result of the NBA’s huge media restructure, a massive financial distribution overhaul.
Watch What’s Trending Now!
The NBA’s new media rights deals are worth $76 billion over 11 years (2025–2036)—a staggering jump from the previous $24 billion agreement. However, the figure is widely cited in the industry, though the NBA and its partners have not actually released the precise financials. It’s a massive step up from the previous deal, which was a nine-year, $24 billion agreement with Disney and Turner Sports (Warner Bros. Discovery). The new landscape splits the regular season and post-season inventory among three major media companies.
Disney has the league’s flagship property in the NBA Finals, plus the big Christmas Day games, the key Wednesday games, and the weekend games. Disney has around 80 regular season games. Reportedly, Disney’s annual payments are around $2.6 billion per year. NBC is back in the NBA for the first time in over 20 years with opening night, the Sunday games, and the Tuesday primetime games, with the exclusive Monday games going to Peacock. NBC has up to 100 regular season games, and that is supported by an annual payment of about $2.5 billion.
Amazon has the exclusive rights to the Emirates NBA Cup (the in-season tournament), the Play-In Tournament, and the weekly Thursday and Friday night regular season games and Amazon is paying an estimated $1.8 billion per year for that package. NBC’s return is a fundamental change to the reach of the league, with the NBA now having two major over-the-air broadcast partners (ABC and NBC) at the same time. The structure of the postseason also provides a good balance between the digital and legacy channel reach. Alongside, NBC and Amazon will alternate the broadcast of one conference finals series in six of the 11 years of the deal.
What Streaming Brings to the Table
The league’s aggressive push into Amazon Prime Video is very much a response to the demise of linear TV in terms of demographics. In its first slate, they averaged 1m viewers across 67 live game windows. Prime Video succeeded where linear TV failed: reaching younger viewers, with a median age of 46.9 versus 55.9 for cable.. The median age of the Prime Video audience was 46.9, nine years younger than the linear TV audience.
“Our new global media agreements with Disney, NBCUniversal and Amazon will maximize the reach and accessibility of NBA games for fans in the United States and around the world,” National Basketball Association commissioner Adam Silver said. However, this demographic shift has immediate trade-offs. Amazon’s 1 million viewer figure is well below the regular season viewing averages that ABC, ESPN and TNT achieved under the previous broadcast rights arrangements. Pure streaming also raises platform reliability issues in the way that a live sports audience simply won’t tolerate buffering, audio issues, and latency during the course of a possession.
Imago
Jan 22, 2026; Inglewood, California, USA; Member of the Amazon Prime NBA broadcast team Candace Parker at Intuit Dome for the game between the Los Angeles Clippers and the Los Angeles Lakers. Mandatory Credit: Jayne Kamin-Oncea-Imagn Images
While the live broadcasts are going through the transition, the league is very much in the business of creating digital discovery via its social platforms as part of the media rights package. The NBA’s global social media channels, according to data, generated a record 228 billion video views. The short-form highlights, the viral plays and the creator content on TikTok, Instagram, and YouTube are a discovery engine in their own right, which is driving interest up into the full broadcast.
The Problem: Fragmentation vs. Reach
Regular season viewing for the NBA was 1.78 million on average. This was across NBC, Peacock, Prime Video, and ESPN. Basically a 16 percent increase from the previous year and the highest regular season average in seven years. Among the broadcasters, NBA was the dominant one, with 2.8 million on average. A 109 percent increase compared to broadcast windows. Fifty‑seven of the telecasts actually saw an audience of over 2 million, the most such broadcasts the league has had since the 2011‑12 season.
Yet those headline figures expose an inconsistency at the heart of the way the media measure things. The NBA can point to a 35 percent increase and claim it is the highest average viewership the NBA has ever had in 13 years. The 16% and 35% increases coexist because fragmented distribution uses different metrics—Nielsen panels vs. first-party streams. Linear networks are reliant on Nielsen’s panel methodology, whereas the digital world has access to first‑party concurrent streams, out‑of‑home and cross‑platform minutes. When you take a league and combine direct stream metrics with broadcast reach, the numbers will vary depending on which partner the NBA is looking at to aggregate the data. In a viewing world, the methodology will have as much of an effect on the story as the on-court action.
The Advertising Side & Long-Term Vision
The NBA’s media architecture is actually two engines working in sync to serve two very different advertising models. The broadcast networks provide scale in the purest form, and the streaming platforms are all about targeting, first-party data, and shoppable ads. The sheer scale of traditional broadcast TV was on full display during the NBA All-Star Game on NBC, which attracted an average of 8.8 million viewers, the largest TV audience for the event since 2011.
As for public ad pricing data, that’s all held very close to the chest. The agencies are certainly keen to strike the right balance between linear reach and programmatic streaming ads. Despite the rising cost of rights fees, which is clearly putting pressure on the networks, Disney is paying a lot more per year ($2.6 billion) for a rather smaller number of games. At the same time, NBC is paying $2.5 billion per year, which in turn forces NBCUniversal to have a much tighter general entertainment and non-sports programming budget to cope with the inflation in sports rights.
Imago
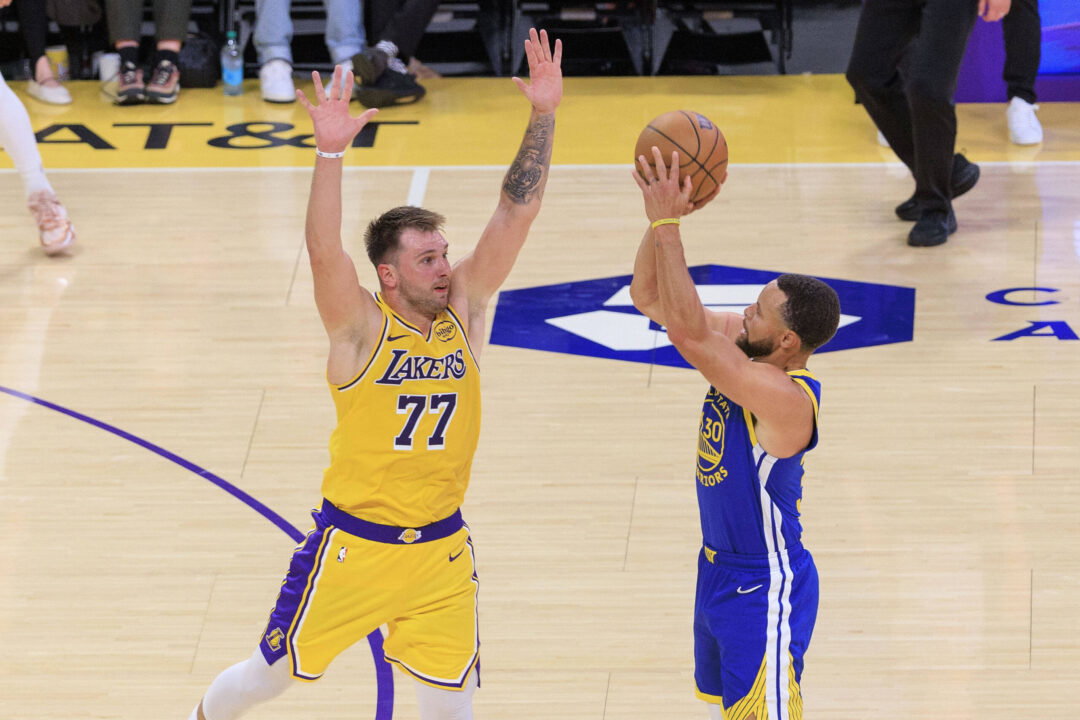
October 21, 2025, Los Angeles, California, USA: Stephen Curry 30 of the Golden State Warriors puts up a shot over Luka Doncic 77 of the Los Angeles Lakers during their regular season NBA, Basketball Herren, USA game on Tuesday October 21, 2025 at Crypto.com Arena in Los Angeles, California. JAVIER ROJAS/PI Los Angeles USA – ZUMAp124 20251021_zaa_p124_037 Copyright: xJavierxRojasx
NBA’s Local TV Turbulence
National broadcast rights are at record levels, while local market distribution is in a state of severe flux. As reported by Forbes recently, the continued collapse and bankruptcy restructurings of Diamond Sports Group (the largest operator of regional sports networks in the US) combined with regional cable attrition has cost 16 NBA teams an estimated $450m in lost local rights revenue.
For years, RSNs provided the teams with a guaranteed, very healthy fee for the rights to their games based on carriage in the cable bundle. With the demise of the cable bundle, the teams now have to very quickly either establish their own direct-to-consumer streaming service or move their games to free local over-the-air television syndication. Over-the-air local gets the games back into the household, but local advertising doesn’t come close to the guaranteed subscriber fee revenues that the old cable model delivered.
The NBA’s multi-billion-dollar strategy is that you need broader access to maintain national relevance. It’s worked in that it’s successfully drawn in the younger streaming audience and delivered massive broadcast rating spikes. It’s done it by asking the fans to go through a fragmented network of patches. As the linear TV contracts expire, the streaming platforms continue to improve their infrastructure, and the local market economics will be looking for a floor. Year 2 of this 11-year cycle will be the test of whether the audience gains we saw in Year 1 are actually going to be sustainable or just a one-off bounce.